

AVIATION SAFETY REPORTING
Aviation has long been at the leading edge of safety and human factors data collection due to the high consequences, visibility, and economic impact of accidents. Large and complex sets of operational and safety data offer many potential insights into emerging risks, trends, and hazards. However, deriving meaningful conclusions from these data sources has become increasingly difficult and labor intensive. Fort Hill Group developed these interactive aviation safety visualizations to demonstrate the power of safety data analytics to drive operational safety intelligence.
ABOUT THE VISUALIZATIONS
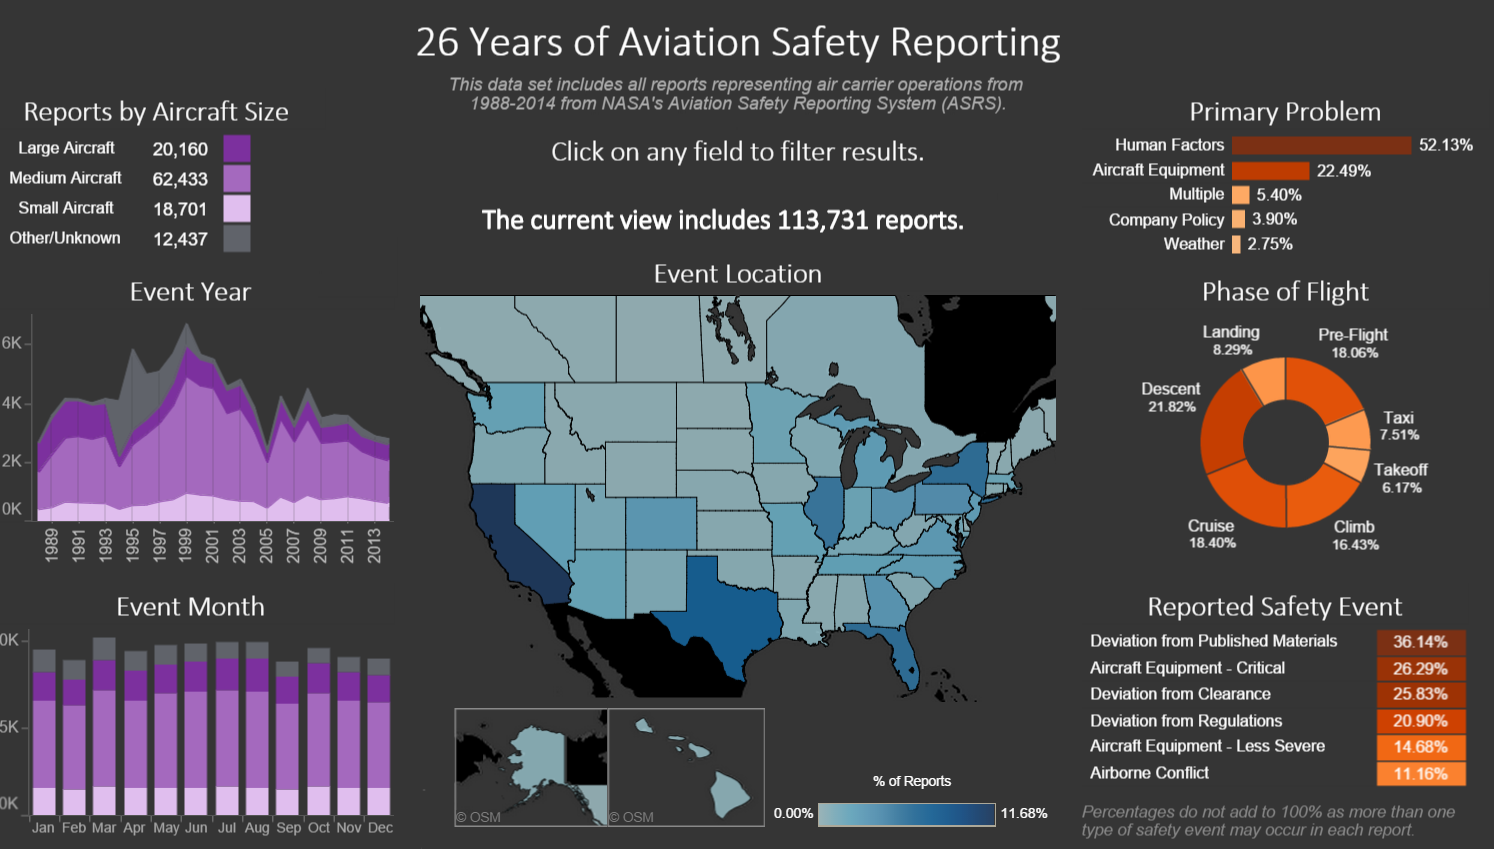
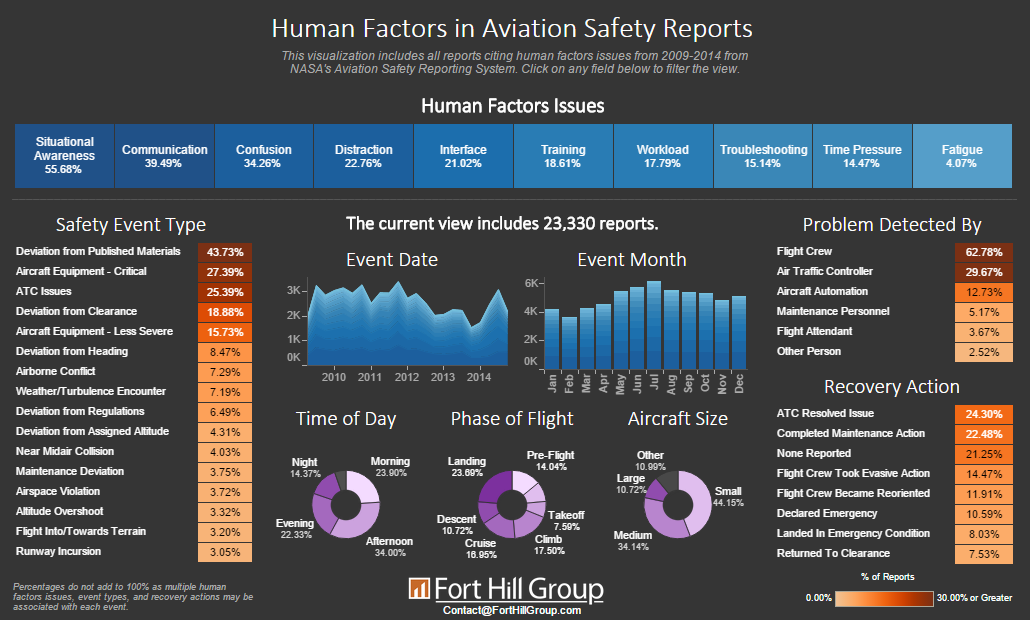
These visualizations are based on a set of 180,000 aviation safety reports collected by NASA’s Aviation Safety Reporting System. The first visualization provides an overall view of commercial aviation safety reports based reports filed between 1988 and 2014. The second visualization focuses on recent human factors trends by including reports citing specific human factors issues between 2009 and 2014. Together these visualizations provide a foundation for analyzing and tracking both broad aviation safety issues and recent human factors trends. More information on the ASRS can be found at http://asrs.arc.nasa.gov/.
Click on an image below to view the visualizations
FEEDBACK
Feedback regarding these ASRS visualizations can be directed to ASRS@FortHillGroup.com
